Assessing Flood Early Warning Systems for Flash Floods
 María J. Henao Salgado
 Jeannette Zambrano Nájera
- 1PhD Program in Engineering - Civil Engineering, Focus on Water Resources Engineering, Universidad Nacional de Colombia, Sede Manizales, Colombia
- 2Department of Civil Engineering, Universidad Nacional de Colombia, Sede Manizales, Colombia
Flash floods are an increasing concern, especially in regions with abrupt topography and small areas where floods are rapid and energy-filled. That is the case of the El Guamo stream basin located in Manizales, Colombia. It has been proposed a duration-independent rainfall threshold for flash floods in this basin, using a hydrodynamic method that links critical water stages to cumulative rainfall. This paper presents a systematic literature review of 19 case studies from 2016 to 2021 to compare and highlight complexities and differences in the methods used in rainfall threshold estimation in both the El Guamo stream basin as in other case studies. The results identified four types of methods: (i) empirical, (ii) hydrological/hydrodynamic, (iii) probabilistic, and (iv) compound. Each method identified the principal indicators and their predictor variables. Each method uses different indicators, such as accumulated rain, accumulated antecedent rainfall, intensity-duration of the rain event, maximum cumulative or cumulative rainfall depth for a specific duration, and critical rainfall within given time periods. Scenario analysis of the predictor variables is a common approach used in rainfall threshold estimation. Some predicting variables found are antecedent moisture conditions, inundation criteria, and synthetic hyetographs. Some case studies include a probabilistic analysis of the predictor variables. This article concludes that indicators and their predicting variables can be adjusted to local flood early warning systems depending on the rainfall threshold method selected. Hydrodynamic models are solid in rainfall threshold estimation. However, it is highly advisable to include uncertainty analysis and new data sources to have more robust rainfall thresholds. Furthermore, probabilistic methods, including uncertainty analysis with utility functions, are a valuable tool to improve decision-making in early warning systems, which can help to refine the rainfall threshold estimation.
Introduction
There is a high flood occurrence originating from natural and anthropological factors in Colombia, South America. Certain peculiarities of these regions, such as the abrupt orography, steep topography, and geomorphological characteristics, make flooding events more rapid and energy-filled. This type of flood is called flash floods, and these can cause destructive events in terms of people and the affected infrastructure. In addition, flash floods are characterized by their short duration and have a relatively high maximum flow, commonly associated with an intense precipitation event over a small area (NOOA, 2012). The impact of the floods has increased even more due to population growth, migration, and other social phenomena. The occurrence of floods is increasing and continuously expanding to previously unaffected areas, a product of urban expansion in Colombia, which causes impacts on the hydrological cycle, reduces infiltration, increases surface runoff, and affects other vital processes which guarantee watersheds stability. According to OSSO Corporation, in Colombia, 16,855 disastrous flood events were reported from 1935 to 2018, which affected 6,930 people resulting in 2,030 deaths, 4,106 injured, and 794 missing. It has been reported that 1,314,415 houses were affected and damaged, causing 25,196 relocations and 368,902 evacuations. Damage to crops and infrastructure is notorious, impacting 2,155,298 hectares of crops and 3,324,622 meters of roads (DESINVENTAR and UNDRR, 2020).
Manizales has faced disasters that were caused by flash floods over its urban streams, especially the Manizales, El Guamo, and Olivares streams. The houses, public infrastructure, and private infrastructure have been affected, but the vulnerable communities living on the river banks of these rivers are of particular concern. Urban areas close to the streams, as mentioned earlier, have suffered the consequences of flash flooding events, mass removals, and torrential avenues (UNAL, 2018). From the period 2000–2013, it was reported that 3,480 people and 415 affected families, 89 destroyed houses, and 27 deaths resulted from hydro-meteorological disasters (Alcaldía de Manizales, 2014). In particular, the flooding event that occurred on October 14, 2011, in the lower-middle part of the El Guamo stream basin left 50 people affected, four houses damaged and one house destroyed, and also material losses to public infrastructure; providing evidence of the high risk of flooding, which the riverside communities of this stream are exposed to DESINVENTAR and UNDRR (2020).
In response to these events, it was decided that a Flood Early Warning System (EWS) in the El Guamo stream basin (one of the most affected basins) should be implemented. For this purpose, an inter-institutional agreement between Corporación Autónoma Regional de Caldas (Corpocaldas) and the Universidad Nacional de Colombia sede Manizales was signed in 2014 (Sánchez et al., 2018). The rainfall threshold method proposed in UNAL (2018) was applied according to Montesarchio et al. (2009), based on the changes in intensity and which is independent of the duration of the event and adopted in the EWS of the El Guamo stream basin.
Rainfall thresholds are defined as the rainfall depth during a storm event that can generate a critical discharge (water stage) at a specific river section (Georgakakos, 1995; Martina, 2010). Rainfall thresholds can be derived using different methods, indicators, and the predictor variables. Four types of methods have been identified, such as the empirical methods, hydrological/hydrodynamic methods, probabilistic methods, and compound methods. Empirical rainfall thresholds are among the most widely used approaches and can be applied to construct EWS, including local, regional and national areas (Aleotti, 2004; Mathew et al., 2014; Segoni et al., 2014). Empirical methods are based on historical flood reports and rainfall data that correlate the occurrence of the event to the magnitude and duration of critical precipitation through a correlation analysis (Cannon et al., 2008; Diakakis, 2012; Montesarchio et al., 2015). Several empirical rainfall threshold curves can be found in literature from different parts of the world (Caine, 1980; Aleotti, 2004; Guzzetti et al., 2007; Brunetti et al., 2010). These studies were focused on different types of shallow landslides and debris flow; however, empirical rainfall thresholds can be used to set a flash flood warning system (Norbiato et al., 2008).
Similarly, hydrological/hydrodynamic rainfall thresholds are based on the concepts of the Flash Flood Guidance (FFG) approach (Mogil et al., 1978; Georgakakos, 1995, 2006; Carpenter et al., 1999; Norbiato et al., 2008). The main idea of the FFG consists of inverse hydrological modeling to determine the rainfall depth that generates minimum flood flow at the outlet of the basin. Alerts are issued if the observed rainfall data in real-time or rainfall forecast exceed the threshold for a particular duration. This approach requires rainfall data by means of real-time rainfall monitoring or rainfall radar (Norbiato et al., 2009). However, other rainfall threshold methods need the same information. FFG is widely used worldwide and in its evolution, it has incorporated the modeling of different forms of synthetic hyetographs, spatially distributed models, and the antecedent soil moisture condition (Moore, 2002). In recent years, hydraulic models have been introduced so that the thresholds are calculated based on the geometry and characteristics of the canal and the relationship between the water level reached and the flooded area (Wu et al., 2015; Candela and Aronica, 2016).
Lastly, probabilistic and compound methods are characterized by a hydrodynamic or empirical methods with probabilistic analyses of variables or probabilistic analyses of rainfall and flood records. These methods seek to establish the dependence between rainfall and the possible consequences (in economic terms) on a section of the river (Golian et al., 2010, 2011). Moreover, these methods have shown a significant improvement from the approaches which are used presently and must be viewed as the first step toward a sound operational approach (Martina et al., 2006). Therefore, these methodologies are designed to simplify the alarm issuance process for decision-makers, allowing the evaluation of the cost/benefit of activating or not the EWS response protocols. Probabilistic approaches advance the current understanding of how humans are impacted by flash floods and empower how to reduce them. Špitalar et al. (2014) mentioned that flash floods need to be analyzed as dynamic, cascading processes with temporal evolving impacts on society.
This paper reviews flood EWS case studies with the proposed rainfall thresholds, indicators, and their predicting variables in different countries. Comparisons are made among the different case studies related to the type of method used, indicators of each method, and their predicting variables. The main idea is to highlight the complexities of implementing a flood EWS and establish general recommendations for improving the alert threshold in the El Guamo stream basin case study. The study investigates rainfall thresholds as early warning tools for different settings and geomorphological conditions, using different data availability, indicators, and the predictor variables.
Materials and Methods
Case Study of the El Guamo Stream Basin
The El Guamo case study was selected with the primary motivation to compare the methodology used and its indicators and highlight possible improvements on alert thresholds in this basin. A particular interest is placed on the Guamo basin because the proposed flood EWS includes high levels of uncertainty due to the considerable complexities of climate and hydro-geomorphic processes. Therefore, improvements to the system are required urgently. The El Guamo stream basin is located in the north-west of the city of Manizales (Colombia), among 8,42,000 m (West), 8,45,000 m (East), 1,052,000 m (South), and 1,056,000 m (North), under the projected coordinate system Colombia-Bogota-Zone with Datum Line in Bogotá (Figure 1). Urban settlements are concentrated within the middle and lower part of the basin. The basin has an area of about 5.06 km2, mean altitude of 2,245 m above sea level, and the average slope of the basin is 29.5% (UNAL, 2018).
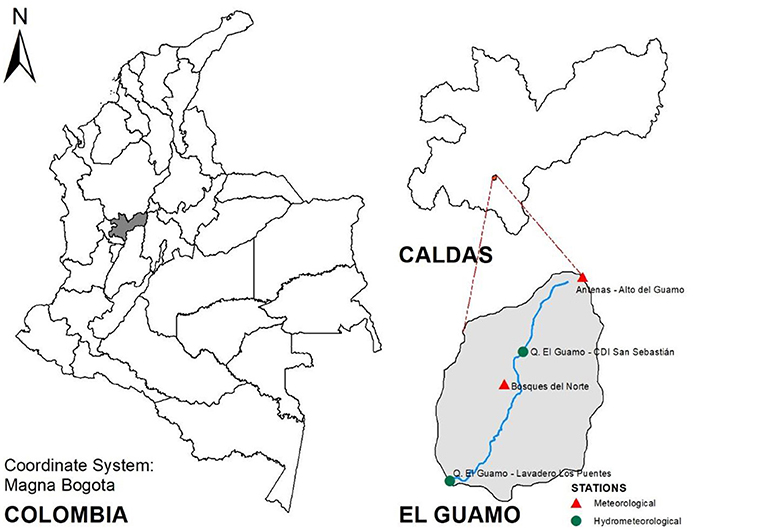
Figure 1. Location of the El Guamo stream basin and network of hydro-meteorological stations.
The UNAL (2018) proposed RT for small basins located in high mountainous regions based on intensity changes and independent of the duration of the event as an indicator for a flood EWS. Hydrodynamic models were the most appropriate option for determining the warning thresholds in the study basin based on rainfall thresholds (UNAL, 2018; Castillo et al., 2020). The rainfall threshold proposed in UNAL (2018) was applied according to Montesarchio et al. (2009), obtained from a distributed hydrological model and a two-dimensional hydraulic model to be adopted in the EWS of the El Guamo stream basin. The main complexities in applying this methodology were a small basin, steep average slope, short time of concentration (Tc), brief warning delay time (~20 min), high flow rates, and sediment transport not considered. Additionally, deficiencies in the correlations and validations of the models at the study because of the short-term rainfall time series (since 2014) provided by meteorological stations, a lack of rainfall data provided by weather radar satellites, and a lack of historical flood records to help to validate the models. Implementing the flood early warning systems might be affected by the high uncertainty of the flood occurrence, intense dynamic riverbed, and rubbish disposed of in the river channel. A summary of the case study of the El Guamo basin of UNAL (2018) is explained in the Supplementary Material.
Methods
The authors performed a systematic literature review focused on the case studies describing rainfall thresholds used in flood early warning systems in the context of flash flood events. Rainfall threshold methods, indicators, and their predictor variables for precipitation and inundation were analyzed and described in this study. The Web of Science and Scopus were the academic databases used. Using the Web of Science and Scopus, the following search terms were applied to identify peer-reviewed journal articles published between the years 2016 and 2021: [“flood” OR “flash flood”] AND [“early warning systems”] AND [“rainfall thresholds”]. A second search equation was employed to investigate the case studies applied in Colombia. The following search terms were selected to identify peer-reviewed journal articles published between the years 2010 and 2021: [“flood early warning systems”] AND [“Colombia”] using all databases. The temporal criteria established were between 2016 and 2021 (inclusive) to derive the existing literature review for all countries. However, for Colombian case studies, the temporal criteria were expanded between 2010 and 2021 (inclusive) to capture all possible relevant studies. No specific criteria of the location of the studied areas, geography, and settings were defined. Nevertheless, Colombian case studies are relevant to comprehending which methods to estimate rainfall threshold have been applied in similar topography conditions, urban settings, climate, and basin areas compared to the El Guamo stream basin.
The article selection process is illustrated in Figure 2. The result of the search found 721 articles. The authors utilized the Tree of Science (ToS) to select the relevant literature related to the topics of interest. ToS is a web-based tool that uses a network structure of paper citation to optimize the search and selection of published papers. ToS was developed at the Universidad Nacional de Colombia (Robledo et al., 2014; Zuluaga et al., 2016). ToS shows the information in the tree shape, where the articles located in the roots are the classics, in the trunk are the structural publications, and leaves are the most current papers. Using ToS for each database (Web of Science and Scopus), from equation one (1) were selected 25 articles of the roots, eight (8) articles of the trunk, and ten (10) articles of the leaves. From equation two (2) of Web of Science and Scopus, the authors included thirteen (13) articles.
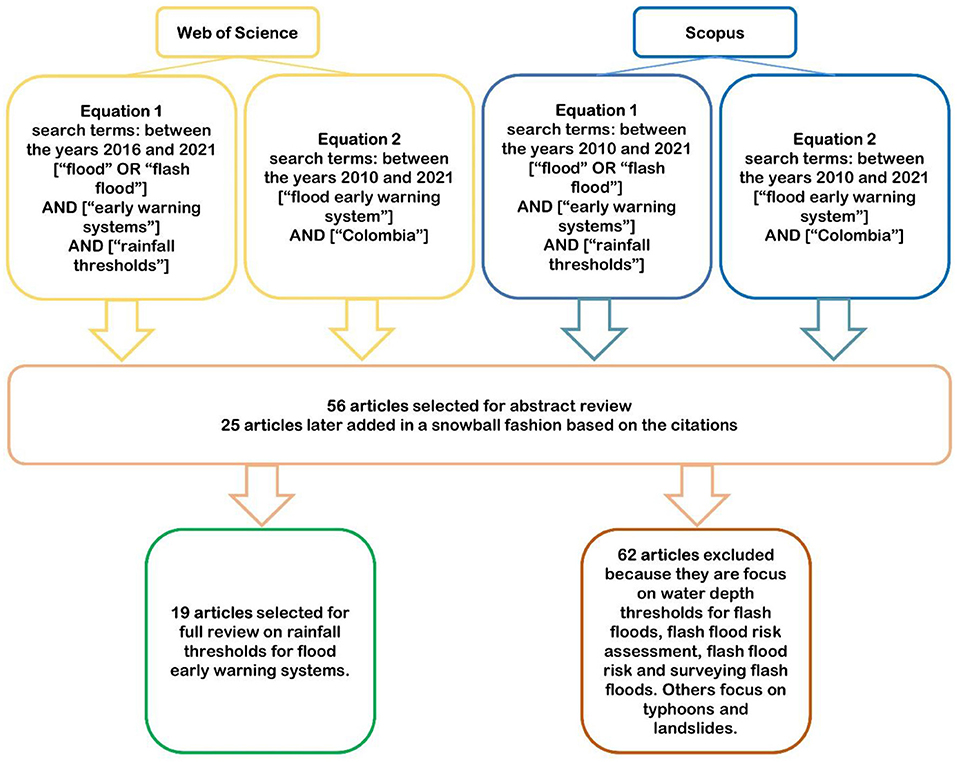
Figure 2. Overview of the systematic literature review.
After reading through the abstracts and scamming the articles, the authors made a further selection and selected the articles focused on rainfall thresholds for flash floods, early warning systems, and relevant studies on these topics. Hence, the authors excluded articles centered on water depth thresholds for flash floods, flash flood risk forecasting, flash flood risk assessment, flash flood risk, and surveying flash floods. Others were removed that focused on typhoons and landslides. Some articles were later added in a snowball fashion based on citations in the papers reviewed, including some articles focused on pluvial floods and floods in general due to the methods used that might be comparable to flash floods case studies. The papers selected were reviewed and retained, especially those with specific calculated rainfall thresholds and flood early warning systems. Among the case studies, it is possible to find various aspects of the studied areas as urban/rural settings, location, type of flood, and climate. After this process, 19 case studies of different methods to estimate rainfall thresholds for flood early warning systems remained.
The authors constructed a matrix with relevant information of each case study such as location, settings, area, climate, type of flood, and rainfall threshold method estimation, to analyze the articles selected (see Supplementary Table 2). In particular, the authors focused on the type of flood, the flood indicator, rainfall threshold method, and the predicting variables involved to derive rainfall thresholds. Finally, the case studies found in the systematic literature review and the case study presented in this paper, were analyzed to evaluate the differences and highlight the complexities of establishing alert thresholds and conclusions were drawn.
Results
Numerous studies have been focused on empirically based rainfall thresholds; however, hydrological and hydrodynamics models which estimate rainfall thresholds (RT) have increased the interest of researchers, due to emerging technologies, better resolution of open spatial-temporal data, low-cost sensing equipment and more available historical flood reports. Furthermore, probabilistic methods are used to investigate the sources of uncertainties of the RT derived, based on the indicators of spatial-temporal rainfall distributions, soil moisture conditions, cumulative rainfall, peak discharge amounts and economic terms. Finally, compound methods combine different methods to derive one or multiple RT, in order to no longer limit an early warning system (EWS) of flash floods to a single index and provide more information and sufficient time to deal with the coming flash floods.
The locations of the case studies are shown in Figure 3. The majority of studies which were reviewed, were carried out in high-income regions within Europe (Montesarchio et al., 2015; Papagiannaki et al., 2015; Candela and Aronica, 2016; Forestieri et al., 2016; Santos and Fragoso, 2016; Bouwens et al., 2018; Hofmann and Schüttrumpf, 2020; Luong et al., 2021) and Asia (Jang, 2015; Wu et al., 2015; Miao et al., 2016; Liu et al., 2018; Zhai et al., 2018; Li et al., 2019). Few studies using RT for flash floods EWS were reported in America (Ávila et al., 2015; UNAL, 2018; Guerrero Hoyos and Aristizábal Giraldo, 2019; Castillo et al., 2020), and low-income countries in Africa (Young et al., 2021). According to our findings, in Colombia, just two case studies based on empirical methods were found to estimate RT, for flash flood or torrential floods (Ávila et al., 2015; Guerrero Hoyos and Aristizábal Giraldo, 2019). No case studies in Colombia, using hydrodynamic models and probabilistic methods, were found in our research. The case study of the El Guamo stream basin is likely to be the first study in Colombia, which used hydrodynamic modeling to derive RT for flash flooding-prone areas and used them in an EWS.
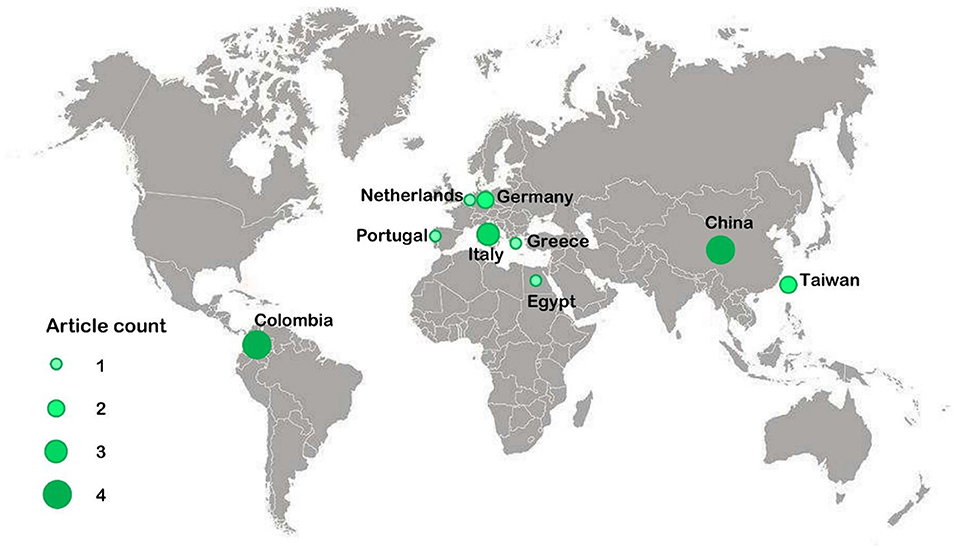
Figure 3. Case studies locations.
Description of the Methodologies
A first approximation to estimate RT are the empirical or statistical methods based on the correlation of historical records of floods with rainfall data (Caine, 1980; Reichenbach et al., 1998; Cannon et al., 2008). These methods relate to one or several parameters of the rainfall event (duration, intensity, frequency, magnitude, and accumulated magnitude) with one or several parameters of flooding events (water depth, discharge, qualitative data, etc.). Moreover, other methods of the same nature investigate the soil moisture for the same correlation (Diakakis, 2012). For example, methods adapted from landslides (Terlien, 1998; Glade et al., 2000; Aristizábal et al., 2011). Empirical RT are mainly based on the relationship of historical records of floods and with precipitation events, from available data. In the urban context, methods include other relevant information as inputs to estimate RT, such as overflow pumping data, crowd-sourced reports (Bouwens et al., 2018) and data from fire services (Papagiannaki et al., 2015).
In these methods, the efficiency of the definition of RT is highly dependent on the quality of the rainfall and floods series used. Rainfall data and historical flood recorded, which are used to estimate RT are constrained by spatial and temporal resolution and flood records which are limited by the number of flood events recorded. Rainfall data is restricted by density, location, accuracy, and record length of rain gauges local network, which affects the generation of RT (Papagiannaki et al., 2015); for this reason, a denser network of rain gauges in the study areas is required, especially in mountainous regions, where capturing rainfall upstream is highly beneficial to flash flooding EWS (Young et al., 2021). In the case of rainfall radar data, this allows you to create more accurate spatial-temporal correlation analysis at pixel levels. Related with temporal resolution, Bouwens et al. (2018) confirmed the relevance of sub-daily temporal resolution in urban settings. Besides, the study of floods records has different challenges respect to number of cases reported, area, extent, temporal resolution (daily), data length, etc. Bezak et al. (2016) suggested that a reasonable length of records should contain at least 10 flooding events exceeding flooding threshold. Finally, a continual review and update to the empirical rainfall threshold derived from each case study based on more available data (further flooding events and rainfall data) will help to give more robust rainfall thresholds.
Advantages of empirical RT methods are (i) they are simple and widely accepted methods (ii) they have few data requirements compared to other methods, (iii) they simplify the physical processes in the study area (Reichenbach et al., 1998), (iv) are applicable to urban and rural settings, and (v) are low-cost to implement in EWS compared to other threshold systems (Bouwens et al., 2018; Speight et al., 2019). Empirical RT has been widely used in landslides and debris flow case studies (Guzzetti et al., 2007; Cannon et al., 2008) and some approaches have been adopted for flash floods (Diakakis, 2012; Guerrero Hoyos and Aristizábal Giraldo, 2019). The simplification of the physical processes in the studied area comes along with the assumption that rainfall is uniformly distributed by time and space. Also, they neglected lithological and morphological stages (including vegetation and soil conditions) and different climate regimes and weather circumstances (Santos and Fragoso, 2016). From this point of view, the simplifications remove the complexities of setting up a hydrological model, that could be counted as an advantage, but in some cases, it is a drawback; especially in tropical environments and mountainous regions, where there is high spatial variability of the rainfall and rainfall temporal patterns (Ávila et al., 2015; Guerrero Hoyos and Aristizábal Giraldo, 2019). Conversely, disadvantages of empirical RT methods are: (i) evaluation of RT are made under the hypothesis that there are no errors or uncertainties in the data used (Montesarchio et al., 2015) and (ii) it neglects social exposure and vulnerability of risk-prone areas (Young et al., 2021).
To overcome the disadvantages mentioned previously, new developments of empirical-based RT are being explored and implemented in some case studies. For instance, Bouwens et al. (2018) performed an analysis of spatial correlation with flooding reports, where they found strong correlations between floods with maximum rainfall depths over 15 and 60 min, confirming the relevance of sub-daily temporal resolutions when investigating the impact of rainfall on urban hydrology (Romero et al., 2011; Ochoa-Rodriguez et al., 2015; Simões et al., 2015; Blenkinsop et al., 2017; Young et al., 2021). Santos and Fragoso (2016) who developed an innovative approach from the study of floods and mentioned the absolute need for daily and hourly real time data of a hydro-meteorological network to estimate more objective precipitation intensity-duration thresholds. Young et al. (2021) derived initial thresholds, quantile relationships with daily rainfall data to identify floods, and exceedance probability analysis of the return period for an EWS for pluvial floods. Thresholds were defined by examining rainfall depths associated with historical flooding events from social media and the associated hazard severity; as well as satellite precipitation products. This methodology can be applied to catchments of short-response and insufficient data. This EWS compares the ensemble of rainfall forecast from Numerical Weather Prediction (NWP) combined with empirical RT approach, which allows characterization of the exceedance likelihood associated with flooding and has the additional benefit of providing timely forecasting while allowing decision-makers to incorporate uncertainty into the forecast.
Empirical-based rainfall thresholds have been used broadly in international and local contexts. Reviewed case studies are located in Italy (Montesarchio et al., 2015), Portugal (Santos and Fragoso, 2016), Greece (Papagiannaki et al., 2015), Netherlands (Bouwens et al., 2018), Egypt (Young et al., 2021) and there are two case studies in the Andean region, in the Aburra Valley (Guerrero Hoyos and Aristizábal Giraldo, 2019) and Cali river catchment (Ávila et al., 2015). Although, there is no evidence that the last two case studies are being implemented in EWS. Relating to the case studies reviewed in Colombia, Guerrero Hoyos and Aristizábal Giraldo (2019) studied torrential floods in the Aburra Valley region, using a Rainfall Triggering Index (RTI) developed by Jan et al. (2018) and putting forward a critical threshold like a flash flood detonating a potential early warning alarm system. Guerrero Hoyos and Aristizábal Giraldo (2019) could not find a direct relationship between the number of rainfall events and the occurrence of torrential floods, due to the absence of historical records of flooding events and rain gauges closer to the torrential flooding areas (sub estimation of rainfall) or upstream where heavy rainfall events are localized. Ávila et al. (2015) presented the first study to focus on understanding the impact of hydro-climatology on flash floods in Colombia (the Cali river catchment), following the methodology defined by Glade et al. (2000) and which were applied to this study, using an empirical antecedent daily rainfall model. These authors used the historical floods database called DESINVENTAR (27 events) and daily records of hydro-meteorological events. Also, they included the influence of antecedent conditions of soil saturation during the occurrence of flash floods.
RT for Flash Flood EWS are also estimated by means of hydrological or hydrodynamic methods (rainfall-runoff models and hydraulic models), which has been proven as a reliable way to simulate the relationship between rainfall and runoff. The hydrological methods are based on the concepts of the FFG approach, which was created by focusing on mountainous regions, uniform rainfall depth/duration over space and time and catchment sizes up to 1,000 km2 (Mogil et al., 1978). The FFG has been modified to include gridded data (Schmidt et al., 2007; Gourley et al., 2012), synthetic hyetographs (Jang, 2015; Montesarchio et al., 2015; Wu et al., 2015; Candela and Aronica, 2016), distributed hydrological model (Jang, 2015; Miao et al., 2016; Zhai et al., 2018), and the dynamic condition of antecedent soil moisture (AMC) (Montesarchio et al., 2015; Luong et al., 2021). Gridded FFG have proposed to derive RT based on rainfall raster data, in order to capture spatial variability (Bae et al., 2018). There are a lot of hydrological methods used in the Rainfall Comparison Method (RCM), such as the Sacramento Soil Moisture Accounting Model, HEC-HMS, geomorphology-based hydrological model GBHM, topography based on the probability distributed model TOPDM, China Flash Flood-Hydrological Modelling system (CNFF-HMS), TETIS model and BROOK90. The RCM has the main objective of defining the critical flow based on if it is possible to estimate the critical rainfall through the relationship between rainfall and runoff, identified by the hydrological simulations (Ntelekos et al., 2006). The RCM contrasts the real-time or forecast rainfall with critical rainfall estimations, in order to determine if an early warning signal is needed to be issued (Zhang and Meng, 2018). An example of a current flood EWS based on RCM is the ERA (Extreme Rainfall Alert) in England and Wales, this system uses ensemble rainfall forecasting to assess the threshold exceeding probability that might cause severe flooding in urban areas (Priest et al., 2011).
Recent developments identified in the case studies reviewed are a hybrid of the deterministic-stochastic approach for multiple RT estimation, new methodologies for ungauged mountainous catchments integrating flooding thresholds and RT (using a simple binary classification of maximum cumulative rainfall, degree of soil saturation, and a flooding threshold), online/offline models which have been developed and combine two warning levels (RT and flow thresholds), the use of an additional water budget model to identify the daily moisture conditions and finally, the inclusion of rainfall forecast into hydrological warning systems. Reviewed case studies of hydrological model-based RT in this study are located in Taiwan (Jang, 2015; Wu et al., 2015), Italy (Montesarchio et al., 2015; Candela and Aronica, 2016; Forestieri et al., 2016), China (Miao et al., 2016; Zhai et al., 2018), Germany (Hofmann and Schüttrumpf, 2020; Luong et al., 2021) and two case studies are located in the Manizales (Andean region in Colombia) (UNAL, 2018; Castillo et al., 2020).
The main advantages of hydrological/hydrodynamic methods are: (i) they are able to capture the physical processes within the basins and simplify some processes that are considered irrelevant depending on each case (i.e., regarding, urban areas, soil water storage and evaporation are less significant processes); (ii) they can be chosen from among different types of hydrological models (lumped, semi-distributed and distributed), with different input data, resolution requirements, and depending on the data availability; (iii) they are applicable to different climates and relate to the influences of weather on them, and (iv) they offer the possibility to include scenario-based simulations, incorporating duration of rainfall events or the effect of temporal and spatial variation of the rainfall events, accounting soil moisture status, introducing land coverage changes, inundation criteria, etc. The biggest disadvantages are (i) they demand high spatial and temporal data resolutions to accurately simulate runoff pathways, especially in urban areas (Jang, 2015); (ii) models must be calibrated and validated with sufficient data, in order to estimate accurate rainfall-runoff dynamics which generate the RT; (iii) they have high time-consuming computation; and (iv) besides, as in empirical methods, these also have uncertainties related to the input data and model parameters (Aronica et al., 2002). The main uncertainty sources are related to errors and the length of the observation data (i.e., rainfall, river discharge, soil moisture conditions, etc.), choice of hydrological/hydraulic model (1, 2 dimensional model) related to model parameterization (i.e. soil moisture storage, roughness coefficients), the absence of data for flood frequency analysis, high resolution and high accuracy of topographic datasets, land use maps and geometry and capacity of the channel section, among others (Jang, 2015; Wu et al., 2015; Candela and Aronica, 2016).
Another methodology which establishes RT is the probabilistic method which is characterized by the use of a combination of the hydrological/hydrodynamic models and probabilistic analysis of variables that influence the estimation of RT. The probabilistic analysis depends on the modeler and its interest, and it can include the uncertainty analysis that defines the flood hazard as the influence of rainfall spatial distribution and its associated probabilities (Golian et al., 2010, 2011), as further uncertainty analysis is introducing an expected cost or utility function (Martina et al., 2006) and lastly, a more robust uncertainty analysis based on the previous analysis, adding the informative entropy concept (Montesarchio et al., 2015). The case study reviewed of Montesarchio et al. (2015) was based on the methodology proposed by Martina et al. (2006), which searched to establish the dependence between rainfall depth for different durations with the corresponding flow peak and their distributions, for each AMC class. Basically, a joint probability function of rainfall depth for a given duration with its corresponding peak discharge values were built up. Later, the joint probability function of rainfall and its corresponding peak discharge was combined with a utility function. The joint distributions of rainfall depth for a given duration and its corresponding peak discharge are being used to evaluate the minimal amount of the expected utility cost function (Bayesian decision theory), and determine the entropy within the context of a flood warning system, in order to calculate RT. In this sense, a decision-maker can evaluate the cost-benefits of activating the flash flood warnings and can have a measure of the uncertainty involved in the system. In fact, Golian et al. (2010) mentioned that probabilistic methods try to establish the dependence and the possible consequences of flooding in economic terms, over a critical cross-section of a river. For instance, a current flood EWS based on probabilistic RT is Pan et al. (2019), this author created a data-driven probabilistic rainfall-inundation model for flash-flood warnings to derive optimized rainfall-inundation thresholds. In this case, the flash flood warning performance was more significant than the official warning system in New Taipei city. The model exports the probability of floods, and it can provide warnings 1–3 h in advance, when the probability is approaching 50%. This model not only quantifies the potential impacts of flood risk for decision makers, but also provides early warnings based on probability changes.
Some advantages of using probabilistic approaches are the improvements in the performance of RT and the flexibility to adopt a different probability hazard range related to RT, as a degree of risk-taking decision by decision-makers. Golian et al. (2011) reported the increase of the critical success index (CSI, a measure of forecasting success) by ~25% based on the inclusion of spatially dependent rainfall scenario, in comparison with the presumed spatially uniformed rainfall scenario. Montesarchio et al. (2015) compared hydrological and probabilistic methods and highlighted the outputs obtained by the probabilistic methods, which performed quite well according to an assessment of RT, based on the method of a two-by-two contingency table proposed by Mason and Graham (1999). This method has a hit rate which is defined as the proportion of events in which a warning is correctly provided, or the probability of detection, and a false rate is defined as a proportion of non-events for which a warning is incorrectly provided, or the probability of a mistake. Results found in Montesarchio et al. (2015) exhibited a higher hit rate and a lower value of false rates, using probabilistic methods instead of hydrological methods. However, to obtain satisfactory results it needs to have extensive and good quality input data to use the probabilistic methods to derive effective RT.
The fourth methodology found in literature are compound methods, which are also called combined methods, because they combine either empirical/hydrological methods with probabilistic methods or flow comparison methods with rainfall comparison methods to derive one or multiple RT. This is an approach that makes the early warnings of flash floods to be no longer limited to a single index and provides more information and sufficient time to deal with the coming flash floods. Three case studies were found: first, Liu et al. (2018) used an empirical and probabilistic method to create a Compound Warning Index (CWI). The CWI method is based on RTI (Jan and Lee, 2004), under different probabilities of flash floods (10, 50 and 90%) and involves flash flooding related factors (e.g., rainfall intensities, antecedent rainfall, and cumulative rainfall). In fact, CWI provides upper and lower boundaries of rainfall warnings that can be divided into three categories (i.e., low, medium, and high probabilities of flash floods). Second, Li et al. (2019) proposed a hybrid approach, combining RCM and flow comparison methods (FCM) to build an EWS. This approach was adopted to calculate the critical rainfall to consider the complex condition of the underlying surface and the mechanism of runoff production. The system provides two indices in rainfall and water stage/flow and sets two thresholds for each indicator to serve for preparation and immediate migration of residents. Finally, Young et al. (2021) combined an empirical RT method with an exceedance probability analysis. It consisted of derivation of an initial RT, quantile relationships and exceedance likelihood of the RTs, associated with flooding.
Currently in Colombia, no evidence was found of flash floods EWS based on RT, except for the current implementation of UNAL, 2018 in the Manizales city. Nevertheless, there are two relevant flood EWS currently operating in Bogotá and Medellín cities, which use flow comparison methods based on water depths at critical cross-sections of the monitored rivers. The EWS of the city of Bogotá used rainfall-runoff models which allowed establishing water depth thresholds in critical sections associated with alert levels (e.g., Tunjuelo river EWS for floods) (FOPAE, 2012; IDIGER, 2019). The EWS of Medellín and the Aburra Valley (El Sistema de Alerta Temprana de Medellín y el Valle de Aburrá—SIATA) called SIATA has numerical and statistical models that determine the probability of the occurrence of upcoming rain events and relate to the water depths in the monitored water bodies. These allow timely alerts to be generated to risk managers, especially for vulnerable communities (SIATA, 2014).
Indicators Used to Derive RT
Empirical methods use different indicators in the definition of RT, such as accumulated rain (AR), accumulated rain the days prior to the occurrence of the flood event (accumulated antecedent rainfall—AAR) and the intensity-duration of the rain event (Guzzetti et al., 2007). The indicators of the empirical methods are shown in Table 1. In the case of AR as an indicator, a day was a common time-period used. When establishing the thresholds some authors used percentiles (75th, 90th, 95th and 99th) which were compared to the design storm of the drainage infrastructure and local knowledge to later, classify these into hazard categories, as the case study developed by Young et al. (2021). The second indicator AAR was found in three case studies reviewed (Ávila et al., 2015; Santos and Fragoso, 2016; Guerrero Hoyos and Aristizábal Giraldo, 2019). They used different days for accumulation classifying them in short term (1, 2, 3, 5 and 7 days) and long term (5, 7, 10, 15, 25, 30, 60 and 90 days). For example, in the Cali River most flash floods were found to be linked to AAR of 5 and 7 days in Ávila et al. (2015), AAR of 1, 3, 7 and 15 days in Guerrero Hoyos and Aristizábal Giraldo (2019), and critical precipitation registered as the AAR from 1 to 90 days in Santos and Fragoso (2016). The AAR accounted for the influence of antecedent conditions of soil saturation when considering the AAR and the AR up to 90 days prior of the event (Ávila et al., 2015). Also, AAR can be combined with the average instantaneous rainfall depth (Guerrero Hoyos and Aristizábal Giraldo, 2019). For the third indicator, the intensity-duration of the rainfall has been considered in two of the case studies reviewed (Papagiannaki et al., 2015; Bouwens et al., 2018), both focused on urban settings and in two types of floods (Pluvial and flash floods, respectively). There were considered intensities for different time periods, 15 and 60 min in Rotterdam (Netherlands), and 10 min and 24 h in Attica prefecture (Greece). Both studies concluded that short time intervals of 10 and 15 min are better predictors of flash floods than AR, which allows us to conclude that, in those cases flow velocities were very high. It is important to highlight that in urban settings it is quite significant to derive short time intervals RT, whereas rural settings are more likely to be more linked to predicting variables as AAR and AR for RT. The rural areas are more influenced by AMC, whereas urban areas are more influenced by the capacity of drainage systems, in fact geomorphological factors and impervious surfaces contribute to flooding conditions differently, in urban and rural areas.
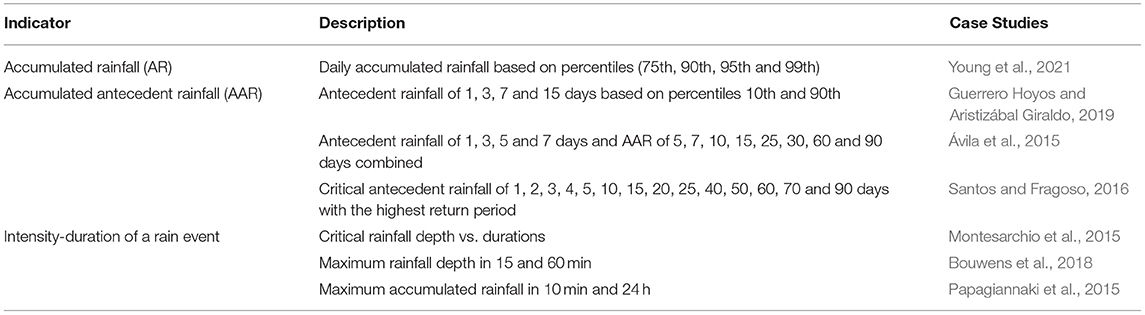
Table 1. Indicators of RT for the empirical methods.
Hydrodynamic methods define RT based on indicators that have a combination of variables that can include scenario-analysis based on rainfall characteristics (rainfall depth, duration and storm pattern), inundation criteria (critical water stage, critical flooding area, higher flood potential sites, probability of discharge and peak discharge) and antecedent soil moisture conditions or soil saturation (see Table 2). The simulations are performed until the critical discharge (critical water stage) which is reached in the corresponding river cross-section for each indicator defined and each duration. These types of methods make it possible to define sub-daily cumulative rainfall depths from 10 min to 72 h. Normally, RT are defined as the cumulative rainfall depth for specific durations, influenced by various combinations of the variables mentioned. RT presents the value of rainfall intensity and accumulated precipitation that occurs immediately prior to flash flood events. This value is related to the characteristic of precipitation, soil moisture, and underlying surface (Diakakis, 2012; Yucel, 2015).
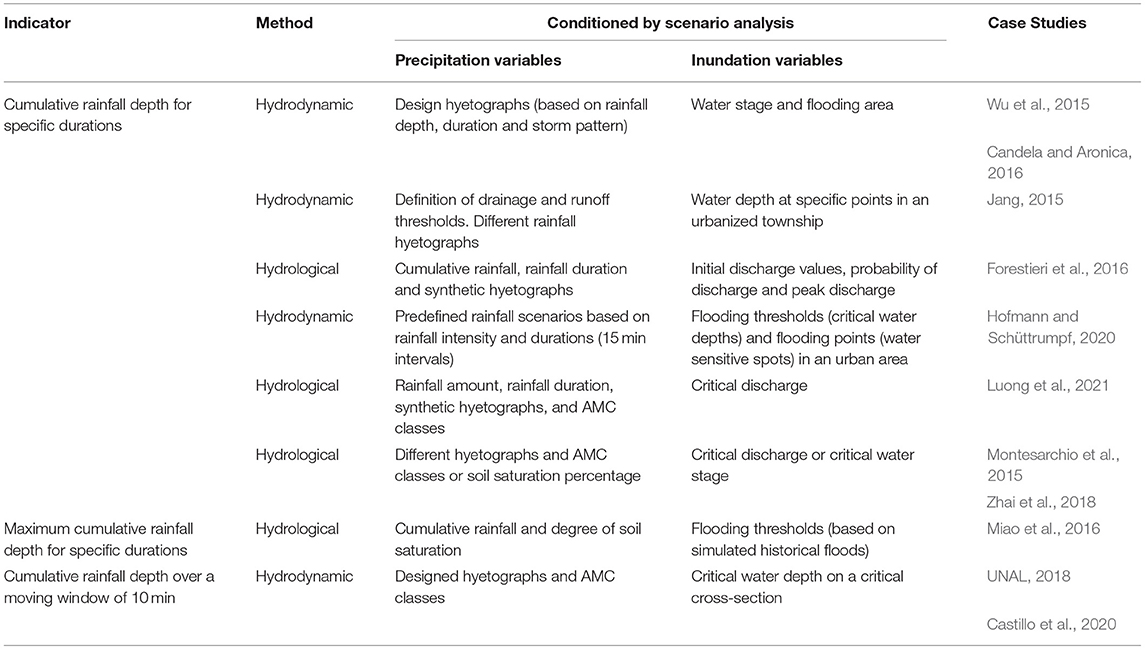
Table 2. Indicators of RT for the hydrological/hydrodynamic methods.
Three case studies that used a combination of inundation criteria and rainfall temporal patterns (synthetic hyetographs) were reviewed (Jang, 2015; Wu et al., 2015; Candela and Aronica, 2016). RT was then defined as cumulative rainfall depth for given durations (1, 3, 6, 12, 24, 48 and 72 h) conditioned by the synthetic hyetographs and inundation criteria, commonly water stage and flooding area. Wu et al. (2015) derived RT with durations of 1, 3, 6, 12 and 24 h conditioned by synthetic hyetographs, water stages at 20, 30, 40 and 50 cm and flooding areas of 0, 1–2 hectares; Jang (2015) derived RT with short durations (1, 3 and 6 h) such as drainage thresholds and long durations (12, 24, 48 and 72 h), like runoff thresholds, conditioned by rainfall hyetographs, water stages >50 cm and higher flood potential sites. The drainage thresholds are based on the criteria for drainage overload and runoff thresholds on the critical rainfall needed to generate disastrous surface runoff. Candela and Aronica (2016) derived RT for given durations of 1 to 8 h conditioned by synthetic hyetographs and the inundation criteria of water depth superior to 0, 3 m and flooding area of 5% of the total area which is considered to be critical. It is important to mention that this combination of synthetic hyetographs and inundation criteria has been implemented into different studies including pluvial floods, flash floods and floods in general. This combination of indicators allows us to analyze the change in the RT due to the various definitions of inundation criteria based on water depths and flooding area that directly affects vulnerable communities and local infrastructure, and considers the effect of the temporal variation in the rainfall events on the identification of local RT.
Furthermore, AMC classes combined with rainfall hyetographs is also very common in hydrodynamic methodologies, different case studies that used this combination were found. On one hand, Montesarchio et al. (2015) estimated RT with durations of 0.5, 1, 3, 6, 12 and 24 h were conditioned by different standard hyetographs (step, triangular increasing rate, triangular decreasing rate and triangular isosceles rate) which are distributed by gridded isohyets, with three AMC classes (wet, typical and dry). On the other hand, Zhai et al. (2018) estimated RT with durations of 1, 2, 3, 6 and 24 h, including the rainfall pattern (H1-design storm hyetograph, H2-linearly increasing hyetograph, H3-linearly decreasing hyetograph, and H4-isosceles triangle hyetograph) and the three AMC classes (based on soil saturation). This combination of indicators allows us to understand the effects of the catchment response to generate river flow, based on soil moisture conditions and rainfall temporal pattern. In fact, RT depend on soil types, soil depths, pre-event soil moistures, and high-precipitation intensities. These factors combine and create the prior conditions to the runoff generation. Soil moisture's initial conditions are among the most important hydrological properties affecting flash flood triggering. Without hydrological analysis, it is impossible to evaluate the flash flooding potential of storms, particularly in the fringe of the flood/no flood threshold (Norbiato et al., 2008).
There are studies that combine a wider selection of the variables listed as Luong et al. (2021), who calculated RT for given durations of 1 to 24 h conditioned by four rainfall patterns (step, triangular, decreasing and increasing hyetograph), current catchment state (wetness condition based on three AMC classes) and water stage higher than 50 cm, equivalent to the average high discharge. This combination scheme was carefully considered to derive RT in Germany, to avoid confusion in its use in flood EWS. UNAL (2018) estimated RT conditioned by designed hyetographs, three AMC classes and inundation criteria (80% of bank-full flow, bank-full flow and overtopping bank-full of infrastructure conditions). RT is derived from and based on cumulative rainfall depth (mm) that accumulates over a moving window of 10-min (10-min analysis window). This duration was selected because in the transit analysis of the hydrograph over the stream, short concentration times were obtained, this means that the peak flow over the critical section occurs during the precipitation event. For this type of basin, it was not possible to create a precipitation threshold depending on the duration of each event, unless the hydro-meteorological monitoring technology is improved with the implementation of radars and climate prediction models. Both case studies aforementioned were evaluated on the context of flash floods, in urban and rural settings.
Other scheme combinations of variables for RT indicators were used by the following authors: Forestieri et al. (2016); Miao et al. (2016) and Hofmann and Schüttrumpf (2020). The first one used cumulative rainfall (between 40 and 250 mm, step of 10 mm) with synthetic rainfall hyetographs (H1-triangular hyetograph with a positive gradient, H2-triangular hyetograph with a negative gradient and H3-isosceles triangle hyetograph), 10 initial discharge values (between 0 and 7 m3/s) and a 10 probability of discharge (between 0 and 1, at step 0.1). Second, Miao et al. (2016) used a new approach using a binary classification of a maximum cumulative rainfall, degree of soil saturation and a flooding threshold. This approach allowed the determination of RT under different antecedent soil moisture values. The RT selected were the maximum cumulative rainfall values for durations 1, 3, 6 and 12 h, but also considered flooding thresholds (flow of 2-year return period obtained) and a degree of soil saturation (0.25, 0.5 and 0.75). Soil saturation was chosen instead of the volumetric soil water content for simplicity, due to soil type which is not spatially uniform in a catchment. Third, Hofmann and Schüttrumpf (2020) used cumulative rainfall depth for given durations of 15, 30, 45 and 60 min which were considered to be uniformly distributed and combined with water depth of 0.2 and 0.5 m at different flooding points. Finally, RT was determined and linked to water sensitive spots at the neighborhood level, using high resolution inundation models with a variable spatial resolution up to 1 m2. To sum up, these new schemes for scenario-analysis of variables are set up for each specific case study related to RT duration, climatic characteristic, rain gauge network, soil water dynamics and settings (urban or rural) and allow us to explore RT derivation and the sensitivity of the predicting variables.
Finally, probabilistic methods and compound methods included new predicting variables for the indicators to calculate RT (see Table 3). In Montesarchio et al. (2015) used rainfall durations of 0.5, 1, 3, 6, 12 and 24 h, three AMC classes and peak discharge as in hydrological models, plus a utility cost function deduced based on a real case of issuing a warning or not. Li et al. (2019) combined flow comparison method (FCM) to rainfall comparison method (RCM). The RT was defined as the critical rainfall of cumulative rainfall for durations of 20 min, 1, 2 and 3 h conditioned by the antecedent precipitation conditions, design rainstorms and critical water stages/flows. Antecedent precipitation is set at three conditions (function of soil maximum storage capacity) and designs rainstorm calculation based on different frequencies and durations (point rainstorms, surface rainstorms and distributions of rainstorms). The critical rainfall is an early warning index that corresponds to the critical water stage/flow at the gauging section under the hypothesis of the same frequency of rainfall and flood flow. Finally, including new predicting variables and comparison methods enables us to explore the decision-making of issuing a warning or not, and make the EW of flash floods no longer limited to a single index, but provides more information and sufficient time to deal with the coming flash floods.

Table 3. Indicators of RT for probabilistic and compound methods.
In this study, rainfall spatial distribution was not counted as a predicting variable. Normally, it is treated as input data, however, for instance, two empirical case studies reviewed and included open spatial data (Bouwens et al., 2018) and GPS-georeferenced flood records (Santos and Fragoso, 2016). Hydrodynamic methods which depend on the type of model selected can include either weather radar or rain gauges data, which are spatially distributed. In the case of radar data, it enables more refined rainfall fields (Lopez et al., 2005; Russo et al., 2006). Highlighting, rainfall spatial distribution imposes a greater effect on the outlet peak discharge produced by rainfall of longer durations (Golian et al., 2011). This indicates that ignoring the spatial dependence in rainfall in RT case studies, underestimates the derivation of RT values.
For the El Guamo stream basin, hydrodynamic models based on scenario analysis of their predicting variables and the mentioned indicator were the most appropriate option for determining the RT in the study basin. According to Golian et al. (2011), for small and rapid response basins, the change in precipitation over time as a trigger for floods is more critical than the total accumulated precipitation. The methodology of the RT is comparable to other hydrological/hydrodynamic case studies exhibited in this study. The RT derived for the El Guamo stream basin are subject to improvements to derive a more robust RT. Short-term improvements might be updating the hydrological model with more extended rainfall time series, including a further uncertainty analysis to derive confidence intervals of the RT, and integrating new data sources of citizen observatories/citizen science. Citizen science can provide valuable and complementary information at all levels of flood risk management (Njue et al., 2019).
Discussion and Conclusions
Interest in early warning systems for flash floods is increasing in different regions of Latin American such as Manizales (Colombia). Few case studies in this region were identified in this literature review. The lack of RT-based EWS in the Andean region countries does not allow scientists to explore the functionality and investigate the potential improvements of these systems. Hence, early warning systems for flash floods in this region need to be designed and consider local time scales, geography, climate, predicting variables, data availability, and the predictive uncertainty of the study area. The monitored variables, the method, and the data requirements should be specifically selected or designed to maximize the skills of the warning systems (Martina, 2010).
Rainfall threshold methods have been implemented in different early warning systems for floods. Many factors play an essential role in RT derivation, such as catchments size, climate, settings, topography, antecedent moisture conditions, long and short rainfall durations, spatio-temporal rainfall patterns, among others. These factors need to be considered when selecting the “best” approach to establish a local early warning system. The methods found in the literature are empirical, hydrological/hydrodynamic, probabilistic, and compound methods. The complexity of the methods increases in the same way as others mentioned previously, depending on the data requirements, data availability, location, and the purpose of the study. Furthermore, indicators can vary depending on the method selected and their predicting variables.
In the first group, empirical methods correlate rainfall data and historical flood records to provide a first-approximation of RT that has a uniform study area and is site-specific. These methods have been broadly used in Europe, Africa and Latin America. The flash flood EWS approach based on empirical RT is considered an immediate short-term solution, especially for data-sparse regions lacking the technical capacity and resources to implement complex methods (Young et al., 2021). For this group of methods, the preferred indicators are: (i) accumulated rainfall (AR), (ii) antecedent accumulated rainfall (ARR), and (iii) intensity-duration of a rainfall event. From most case studies reviewed, the indicators found are the AR and AAR for daily precipitation and intensity-duration events of 10, 15, 60 min, and 24 h (duration) as the most common time steps. The indicators AR and AAR are not suitable for urban areas, where sub-daily time scales are more realistic of flood events in urban settings. For urban areas, intensity-duration is the best indicator, and durations of 10–60 min are the best time interval for derived thresholds for pluvial floods and flash floods. Indicators AR and ARR are typically used in rural settings or catchment scales. The AMC greatly influences rural areas, while the capacity of drainage systems influences urban areas. The difference between urban and rural areas is due to the unique characteristics of the physical processes of each area.
The hydrological/hydrodynamic methods in the second group are more robust approaches to derive RT. These methods use hydrological models (lumped, semi-distributed or fully distributed) or hydrodynamic models (1D or 2D) to simulate floods predominantly caused by rainfalls events. Modeling and scenario-analysis allow the combination and introduction of new variables to derive RT such as rainfall characteristics, AMC classes and inundation criteria. Within these methods, the importance of AMC in the characterization of flash floods or flooding was highlighted by different authors (Longobardi and Villani, 2003; Marchi et al., 2010). AMC behaves differently in rural and urban areas. In urban areas, AMC is less crucial and is related to the capacity of drainage systems and impervious surfaces, whereas rural areas are influenced by soil moisture conditions and catchment response to flow generation. These methods are constrained by the need for input data, which could introduce many errors and uncertainties. Thus, the empirical methods are more suitable for areas with sparse data. Hydrological/hydrodynamic methods have been proven to perform better and have more efficiency within RT-based EWS. These methods have offered additional advantages to estimating the local RT when implemented within the floods EWS (Montesarchio et al., 2015). Hydrodynamic modeling in the El Guamo stream basin included three antecedent moisture conditions, three design hyetographs, and three water stages over critical sections. That allowed to obtain a suitable RT; however, false alarms remained a concern as uncertainties persisted.
In the third and fourth groups, probabilistic and compound methods use a combination of the empirical/hydrological models and probabilistic analyses of variables [i.e., expected cost or utility function by Martina et al. (2006)]. Probabilistic analysis depends on the interests of the modeler and may include a further uncertainty analysis to understand the quantitative errors associated with the predictor variables used to derive the RT indicators. These methods improve the performance of empirical and hydrological methods with the probabilistic analysis of additional variables (i.e., the utility and entropy functions). These methods can be seen as a step toward a sound real-time operational EWS, improving the flexibility of deciding authorities to make decisions about when to issue an alert or not, based on the degree of risk-taking and the expected cost of potentially hazardous floods. Moreover, understanding the uncertainty of different variables in the derivation of RT allows exploring the sensitivity of these variables (i.e., spatial rainfall distribution) and providing confidence intervals based on the uncertainty of these variables, which are relevant to a particular case study. In the case of the El Guamo stream basin, uncertainty analysis is considered an improvement because making a decision based solely on rainfall is considered high risk. In addition, compounds methods make it possible to reduce uncertainty by including different RT indicators, which allows analyzing other forms of flood occurrence. In the El Guamo stream basin, this approach will be of interest.
The recent development of the application of rainfall forecasts using RT-based methods, as such as quantitative precipitation forecasting (QPF) or weather rainfall forecasting (WRF), is a crucial matter in increasing warning lead times in those cases that require further studies to quantify and reduce the uncertainties in the process (Jang, 2015). Real-time hydrological forecasting imposes considerable challenges, such as time-consuming and limited observation capacity, data availability, quality of different meteorological forecasts (predictability) of heavy precipitation events, and increased potential of system failures during flooding emergencies (Martina et al., 2006; Miao et al., 2016; Zhai et al., 2018; Luong et al., 2021). A significant limitation of rainfall forecasting using RT-based methods is the spatial scale, which plays a key role in determining flash floods, as rainfall forecasting is usually done at a regional scale by NWP. Other limitations are real-time data collection, processing (radar data assimilation), preparation, and simulation which can take considerable time to release flood inundation forecasts. Nonetheless, the entire process can be automated as an expert system to provide reliable inundation forecasts in real-time (Ghosh et al., 2019). Improved refinement in rainfall forecasting is needed for flash flood early warning systems, as this is the most effective way to mitigate the effects of flash floods (Papagiannaki et al., 2015).
For the El Guamo stream basin, hydrological models were the most appropriate option for determining the RT in the study basin. UNAL (2018) proposed a RT for small basins located in high mountain regions based on intensity change and independent of the duration of the event, given that the results suggested that the basin was highly sensitive to changes in intensity and less sensitive to the magnitude of the rain event. RT derived for the El Guamo stream basin are subject to improvement. Based on the methods reviewed, improvements in the El Guamo basin case study include new data sources (i.e., citizen observatories and crowdsourced data) and uncertainty analysis, including local predicting variables.
Overall, the improvement and implementation of flash flood EWS in Colombia are hampered by the challenging factors, such as the geomorphological characteristics of the watersheds in mountainous regions, humid and semi-humid climate, topography, short time of concentration, hydro-meteorological conditions, as well as the length and accuracy of flood records and rainfall data, and the high resolution (i.e., high-resolution digital elevation models) of input data for hydrological/hydrodynamic models. The main challenge is centered on improving the data availability and quality of data, extending the overall coverage of monitoring networks and incentivizing research on these topics to better understand the physical phenomena in the study areas. Moreover, insufficient datasets for calibration and validation with respect to water level, discharge, flood depth and flood extent indicate that there is no provision for an accurate hydrodynamic modeling. Future works may be strengthening linkages and correlations between the methods, indicators and their predicting variables with the performance and the probability values of detection and false alarms of flood early warning systems.
Author Contributions
All authors contributed to manuscript revision, read, and approved the submitted version.
Funding
This project was funded by Alcaldía de Manizales under the project Methodological Proposal for the Implementation of Citizen Participation in the Protocol of Early Warning Systems for Floods in the City of Manizales and its surroundings and by the Universidad Nacional de Colombia under the project “Call to Support Postgraduate Students of the Faculty of Engineering and Architecture of the Universidad Nacional de Colombia, Sede Manizales through the granting of a Scholarship-Internship 2021”.
Conflict of Interest
The authors declare that the research was conducted in the absence of any commercial or financial relationships that could be construed as a potential conflict of interest.
Publisher's Note
All claims expressed in this article are solely those of the authors and do not necessarily represent those of their affiliated organizations, or those of the publisher, the editors and the reviewers. Any product that may be evaluated in this article, or claim that may be made by its manufacturer, is not guaranteed or endorsed by the publisher.
Supplementary Material
The Supplementary Material for this article can be found online at: https://www.frontiersin.org/articles/10.3389/fclim.2022.787042/full#supplementary-material
References
Alcaldía de Manizales. (2014). Gestión del Riesgo Memoria Histórica 2001 - 2013, Gestión del Riesgo Manizales. Gestión de Riesgo de Manizalesión de Riesgo de Manizales. Available online at: http://idea.manizales.unal.edu.co/sitios/gestion_riesgos/memoria.php (accessed September 04, 2021).
Aleotti, P. (2004). A warning system for rainfall-induced shallow failures. Eng. Geol. 73, 247–265. doi: 10.1016/j.enggeo.2004.01.007
Aristizábal, E., González, T., Montoya, J. D., Vélez, J. I., Martínez, H., and Guerra, A. (2011). Análisis de umbrales empíricos de lluvia para el pronóstico de movimientos en masa en el Valle de Aburrá, Colombia. Revista EIA 8,95–111.
Aronica, G., Bates, P. D., and Horritt, M. S. (2002). Assessing the uncertainty in distributed model predictions using observed binary pattern information within GLUE. Hydrol. Process. 16, 2001–2016. doi: 10.1002/hyp.398
Ávila, A. D., Carvajal, Y. E., and Justino, F. (2015). Representative rainfall thresholds for flash floods in the Cali river watershed, Colombia. Nat. Hazards Earth Syst. Sci. Discuss. 3, 4095–4119. doi: 10.5194/nhessd-3-4095-2015
Bae, D. H., Lee, M. H., and Moon, S. K. (2018). Development of a precipitation-Area curve for warning criteria of short-duration flash flood. Nat. Hazards Earth Syst. Sci. 18, 171–183. doi: 10.5194/nhess-18-171-2018
Bezak, N., Šraj, M., and Mikoš, M. (2016). Copula-based IDF curves and empirical rainfall thresholds for flash floods and rainfall-induced landslides. J. Hydrol. 541, 272–284. doi: 10.1016/j.jhydrol.2016.02.058
Blenkinsop, S., Lewis, E., Chan, S. C., and Fowler, H. J. (2017). Quality-control of an hourly rainfall dataset and climatology of extremes for the UK. Int. J. Climatol. 37, 722–740. doi: 10.1002/joc.4735
Bouwens, C., ten Veldhuis, M.-C., Schleiss, M., Tian, X., and Schepers, J. (2018). Towards identification of critical rainfall thresholds for urban pluvial flooding prediction based on crowdsourced flood observations. Hydrol. Earth Syst. Sci. Discuss. doi: 10.5194/hess-2017-751
Brunetti, M. T., Peruccacci, S., Rossi, M., Luciani, S., Valigi, D., and Guzzetti, F. (2010). Rainfall thresholds for the possible occurrence of landslides in Italy. Nat. Hazards Earth Syst. Sci. 10, 447–458. doi: 10.5194/nhess-10-447-2010
Caine, N. (1980). The rainfall intensity-duration control of shallow landslides and debris flows. Geografiska Annaler Ser. A 62, 23–27. doi: 10.1080/04353676.1980.11879996
Candela, A., and Aronica, G. T. (2016). Rainfall thresholds derivation for warning pluvial flooding risk in urbanised areas. E3S Web Conf. 7, 3–8. doi: 10.1051/e3sconf/20160718016
Cannon, S. H., Gartner, J. E., Wilson, R. C., Bowers, J. C., and Laber, J. L. (2008). Storm rainfall conditions for floods and debris flows from recently burned areas in southwestern Colorado and southern California. Geomorphology 96, 250–269. doi: 10.1016/j.geomorph.2007.03.019
Carpenter, T. M., Sperfslage, J. A., Georgakakos, K. P., Sweeney, T., and Fread, D. L. (1999). National threshold runoff estimation utilizing GIS in support of operational flash flood warning systems. J. Hydrol. 224, 21–44. doi: 10.1016/S0022-1694(99)00115-8
Castillo, R. A., Chang, P., Julián, J., Upegui, V., Nájera, J. Z., et al. (2020). Umbrales de precipitación basados en intensidad para crecidas torrenciales en la quebrada Manizales, Colombia Rainfall thresholds based on intensity for flash floods in the Manizales River, Colombia Umbrais de chuva baseados em intensidade para inundaçõ. EIA 17, 1–17. doi: 10.24050/reia.v17i33.1302
DESINVENTAR and UNDRR. (2020). Flood Data Colombia. Sendai Framework for Disaster Risk Reduction. Available online at: https://www.desinventar.net/DesInventar/profiletab.jsp (accessed September 4, 2021).
Diakakis, M. (2012). Rainfall thresholds for flood triggering. The case of Marathonas in Greece. Nat. Hazards 60, 789–800. doi: 10.1007/s11069-011-9904-7
FOPAE. (2012). Prevención y preparación frente a riesgos por inundación en Bogotá. Sistemas de Alerta Temprana Para Inundación. Presentación FOPAE.
Forestieri, A., Caracciolo, D., Arnone, E., and Noto, L. V. (2016). Derivation of rainfall thresholds for flash flood warning in a sicilian basin using a hydrological model. Procedia Eng. 154, 818–825. doi: 10.1016/j.proeng.2016.07.413
Georgakakos, K. (1995). “Real-time prediction for flood warning and management,” in US-Italy Research Workshop on the Hydrometeorology, Impacts, and Management of Extreme Floods (Perugia). Available online at: http://www.engr.colostate.edu/~jsalas/us-italy/papers/23georgakakos.pdf (accessed September 10, 2021).
Georgakakos, K. P. (2006). Analytical results for operational flash flood guidance. J. Hydrol. 317, 81–103. doi: 10.1016/j.jhydrol.2005.05.009
Ghosh, S., Karmakar, S., Saha, A., Mohanty, M. P., Ali, S., Raju, S. K., et al. (2019). Development of India ' s first integrated expert urban flood forecasting system for Chennai. Sci. Correspond. 117, 741–745.
Glade, T., Crozier, M., and Smith, P. (2000). Applying probability determination to refine landslide-triggering rainfall thresholds using an empirical “Antecedent daily rainfall model.” Pure Appl. Geophys. 157, 1059–1079. doi: 10.1007/s000240050017
Golian, S., Saghafian, B., Elmi, M., and Maknoon, R. (2011). Probabilistic rainfall thresholds for flood forecasting: evaluating different methodologies for modelling rainfall spatial correlation (or dependence). Hydrol. Process. 25, 2046–2055. doi: 10.1002/hyp.7956
Golian, S., Saghafian, B., and Maknoon, R. (2010). Derivation of probabilistic thresholds of spatially distributed rainfall for flood forecasting. Water Resour. Manag. 24, 3547–3559. doi: 10.1007/s11269-010-9619-7
Gourley, J. J., Erlingis, J. M., Hong, Y., and Wells, E. B. (2012). Evaluation of tools used for monitoring and forecasting flash floods in the united states. Weather Forecast. 27, 158–173. doi: 10.1175/WAF-D-10-05043.1
Guerrero Hoyos, L. Á., and Aristizábal Giraldo, E. (2019). Critical rainfall threshold analysis and estimation for flash flood occurrence in Aburrá Valley (Antioquia). Revista EIA. Universidad EIA 16, 97–111. doi: 10.24050/reia.v16i32.1281
Guzzetti, F., Peruccacci, S., Rossi, M., and Stark, C. P. (2007). Rainfall thresholds for the initiation of landslides in central and southern Europe. Meteorol. Atmos. Phys. 98, 239–267. doi: 10.1007/s00703-007-0262-7
IDIGER. (2019). Sistema de Alerta de Bogotá. SIRE. Available online at: https://www.sire.gov.co/web/sab (accessed January 25, 2022).
Jan, C. D., and Lee, M. H. (2004). A debris-flow rainfall-based warning model. J. Chin. Soil Water Conserv. 35, 275–285.
Jan, C. D., Wang, J. S., Zeng, Y. C., and Kuo, F. (2018). TXT-tool 2.886-1.1: Early Warning Criteria for Debris Flows and Their Application in Taiwan (Sassa K. e). Cham: Springer. doi: 10.1007/978-3-319-57774-6_30
Jang, J. H. (2015). An advanced method to apply multiple rainfall thresholds for urban flood warnings. Water (Switzerland) 7, 6056–6078. doi: 10.3390/w7116056
Li, Z., Zhang, H., Singh, V. P., Yu, R., and Zhang, S. (2019). A simple early warning system for flash floods in an ungauged catchment and application in the Loess Plateau, China. Water (Switzerland) 11, 426. doi: 10.3390/w11030426
Liu, C., Guo, L., Ye, L., Zhang, S., Zhao, Y., and Song, T. (2018). A review of advances in China's flash flood early-warning system. Nat. Hazards 92, 619–634. doi: 10.1007/s11069-018-3173-7
Longobardi, A., and Villani, P. (2003). On the relationship between runoff coefficient and catchment initial conditions. Model. Simul. Soc. Aust. N. Z. 2, 1–6.
Lopez, V., Napolitano, F., and Russo, F. (2005). Calibration of a rainfall-runoff model using radar and raingauge data. Adv. Geosci. 2, 41–46. doi: 10.5194/adgeo-2-41-2005
Luong, T. T., Pöschmann, J., Kronenberg, R., and Bernhofer, C. (2021). Rainfall threshold for flash flood warning based on model output of soil moisture: case study wernersbach, germany. Water (Switzerland) 13, 1–15. doi: 10.3390/w13081061
Marchi, L., Borga, M., Preciso, E., and Gaume, E. (2010). Characterisation of selected extreme flash floods in Europe and implications for flood risk management. J. Hydrol. 394, 118–133. doi: 10.1016/j.jhydrol.2010.07.017
Martina, M. L. V. (2010). “Flash flood guidance based on rainfall thresholds: an example of a probabilistic decision approach for early warning systems,” in Flash Floods and Pluvial Flooding (Cagliari).
Martina, M. L. V., Todini, E., and Libralon, A. (2006). A Bayesian decision approach to rainfall thresholds based flood warning. Hydrol. Earth Syst. Sci. 10, 413–426. doi: 10.5194/hess-10-413-2006
Mason, S. J., and Graham, N. E. (1999). Conditional probabilities, relative operating characteristics, and relative operating levels. Weather Forecast. 14, 713–725. doi: 10.1175/1520-0434(1999)014<0713:CPROCA>2.0.CO;2
Mathew, J., Babu, D. G., Kundu, S., Kumar, K. V., and Pant, C. C. (2014). Integrating intensity-duration-based rainfall threshold and antecedent rainfall-based probability estimate towards generating early warning for rainfall-induced landslides in parts of the Garhwal Himalaya, India. Landslides 11, 575–588. doi: 10.1007/s10346-013-0408-2
Miao, Q., Yang, D., Yang, H., and Li, Z. (2016). Establishing a rainfall threshold for flash flood warnings in China's mountainous areas based on a distributed hydrological model. J. Hydrol. 541, 371–386. doi: 10.1016/j.jhydrol.2016.04.054
Mogil, H. M., Monro, J. C., and Groper, H. S. (1978). NWS's flash flood warning and disaster preparedness programs. Bull. Am. Meteorol. Soc. 59, 690–699. doi: 10.1175/1520-0477(1978)059<0690:NFFWAD>2.0.CO;2
Montesarchio, V., Lombardo, F., and Napolitano, F. (2009). Rainfall thresholds and flood warning: an operative case study. Nat. Hazards Earth Syst. Sci. 9, 135–144. doi: 10.5194/nhess-9-135-2009
Montesarchio, V., Napolitano, F., Rianna, M., Ridolfi, E., Russo, F., and Sebastianelli, S. (2015). Comparison of methodologies for flood rainfall thresholds estimation. Nat. Hazards 75, 909–934. doi: 10.1007/s11069-014-1357-3
Moore, R. D. (2002). Aspects of Uncertainty, Reliability, and Risk in Flood Forecasting Systems Incorporating Weather Radar. Risk, Reliability, Uncertainty, and Robustness of Water Resource Systems. Available online at: https://books.google.com.co/books?hl=es&lr=&id=Gigpmr6nyLUC&oi=fnd&pg=PA30&dq=Aspects+of+uncertainty,+reliability+and+risk+in+flood+forecasting+systems+incorporating+weather+radar&ots=N8BjRxnfoj&sig=vlga8hBjw5ePWK2hWBH10wFXcmo&redir_esc=y#v=onepage&q=Aspe (accessed September 04, 2021).
Njue, N., Stenfert Kroese, J., Gräf, J., Jacobs, S. R., Weeser, B., Breuer, L., et al. (2019). Citizen science in hydrological monitoring and ecosystem services management: State of the art and future prospects. Sci. Total Environ. 693:133531. doi: 10.1016/j.scitotenv.2019.07.337
NOOA. (2012). Guía de referencia para sistemas de alerta temprana de crecidas repentinas 2012 (The University Corporation for Atmospheric Research). Washington, DC: National Oceanic and Atmospheric Administration.
Norbiato, D., Borga, M., Degli Esposti, S., Gaume, E., and Anquetin, S. (2008). Flash flood warning based on rainfall thresholds and soil moisture conditions: An assessment for gauged and ungauged basins. J. Hydrol. 362, 274–290. doi: 10.1016/j.jhydrol.2008.08.023
Norbiato, D., Borga, M., and Dinale, R. (2009). Flash flood warning in ungauged basins by use of the flash flood guidance and model-based runoff thresholds. Meteorol. Appl. 16, 65–75. doi: 10.1002/met.126
Ntelekos, A. A., Georgakakos, K. P., and Krajewski, W. F. (2006). On the uncertainties of flash flood guidance: toward probabilistic forecasting of flash floods. J. Hydrometeorol. 7, 896–915. doi: 10.1175/JHM529.1
Ochoa-Rodriguez, S., Wang, L. P., Gires, A., Pina, R. D., Reinoso-Rondinel, R., Bruni, G., et al. (2015). Impact of spatial and temporal resolution of rainfall inputs on urban hydrodynamic modelling outputs: a multi-catchment investigation. J. Hydrol. 531, 389–407. doi: 10.1016/j.jhydrol.2015.05.035
Pan, T. Y., Lin, H. T., and Liao, H. Y. (2019). A data-driven probabilistic rainfall-inundation model for flash-flood warnings. Water (Switzerland) 11, 2534. doi: 10.3390/w11122534
Papagiannaki, K., Lagouvardos, K., Kotroni, V., and Bezes, A. (2015). Flash flood occurrence and relation to the rainfall hazard in a highly urbanized area. Nat. Hazards Earth Syst. Sci. 15, 1859–1871. doi: 10.5194/nhess-15-1859-2015
Priest, S. J., Parker, D. J., Hurford, A. P., Walker, J., and Evans, K. (2011). Assessing options for the development of surface water flood warning in england and wales. J. Environ. Manag. 92, 3038–3048. doi: 10.1016/j.jenvman.2011.06.041
Reichenbach, P., Cardinali, M., De Vita, P., and Guzzetti, F. (1998). Regional hydrological thresholds for landslides and floods in the Tiber River Basin (central Italy). Environ. Geol. 35, 146–159. doi: 10.1007/s002540050301
Robledo, G. S., Osorio, Z. G. A., and López, E. C. (2014). Networking en pequeña empresa: una revisión bibliográfica utilizando la teoria de grafos. Revista Vínculos 11, 6–16. doi: 10.14483/2322939X.9664
Romero, Y. L., Bessembinder, J., van de Giesen, N. C., and van de Ven, F. H. M. (2011). A relation between extreme daily precipitation and extreme short term precipitation. Clim. Change 106, 393–405. doi: 10.1007/s10584-010-9955-x
Russo, F., Lombardo, F., Napolitano, F., and Gorgucci, E. (2006). Rainfall stochastic modeling for runoff forecasting. Phys. Chem. Earth 31, 1252–1261. doi: 10.1016/j.pce.2006.06.002
Sánchez, C., Mejia, F., and Zambrano, J. (2018). Sistema Integrado de Monitoreo Ambiental de Caldas – SIMAC. Manizales: Boletín Ambiental Instituto de Estudios Ambientales IDEA - UN Sede Manizales.
Santos, M., and Fragoso, M. (2016). Precipitation thresholds for triggering floods in the Corgo basin, Portugal. Water (Switzerland) 8, 376. doi: 10.3390/w8090376
Schmidt, J. A., Anderson, A. J., and Paul, J. H. (2007). “Spatially-variable, physically-derived flash flood guidance,” in AMS Annual Meeting, (Tulsa, OK), 1–12.
Segoni, S., Rosi, A., Rossi, G., Catani, F., and Casagli, N. (2014). Analysing the relationship between rainfalls and landslides to define a mosaic of triggering thresholds for regional-scale warning systems. Nat. Hazards Earth Syst. Sci. 14, 2637–2648. doi: 10.5194/nhess-14-2637-2014
SIATA. (2014). Sistema de Alerta Temprana de Medellín y el Valle de Aburrá. Available online at: http://www.siata.gov.co/newpage/index.php (accessed September 15, 2021).
Simões, N. E., Ochoa-Rodríguez, S., Wang, L. P., Pina, R. D., Marques, A. S., Onof, C., et al. (2015). Stochastic urban pluvial flood hazard maps based upon a spatial-temporal rainfall generator. Water (Switzerland) 7, 3396–3406. doi: 10.3390/w7073396
Speight, L., Cranston, M., Kelly, L., and White, C. J. (2019). Towards Improved Surface Water Flood Forecasts for Scotland: A Review of UK and International Operational and Emerging Capabilities for the Scottish Environment Protection Agency. Glasgow: University of Strathclyde.
Špitalar, M., Gourley, J. J., Lutoff, C., Kirstetter, P. E., Brilly, M., and Carr, N. (2014). Analysis of flash flood parameters and human impacts in the US from 2006 to 2012. J. Hydrol. 519, 863–870. doi: 10.1016/j.jhydrol.2014.07.004
Terlien, M. T. J. (1998). The determination of statistical and deterministic hydrological landslide-triggering thresholds. Environ. Geol. 35, 124–130. doi: 10.1007/s002540050299
UNAL. (2018). Estimacion de umbrales Preliminares para la activacion del SAT para las cuencas Quebrada El Guamo, Olivares Manizales. Manizales: Instituto de Estudios Ambientales IDEA. Universidad Nacional de Colombia, sede Manizales, Vol. 1, 1–174.
Wu, S. J., Hsu, C. T., Lien, H. C., and Chang, C. H. (2015). Modeling the effect of uncertainties in rainfall characteristics on flash flood warning based on rainfall thresholds. Nat. Hazards 75, 1677–1711. doi: 10.1007/s11069-014-1390-2
Young, A., Bhattacharya, B., and Zevenbergen, C. (2021). A rainfall threshold-based approach to early warnings in urban data-scarce regions: a case study of pluvial flooding in Alexandria, Egypt. J. Flood Risk Manag. 14, 1–16. doi: 10.1111/jfr3.12702
Yucel, I. (2015). Assessment of a flash flood event using different precipitation datasets. Nat. Hazards 79, 1889–1911. doi: 10.1007/s11069-015-1938-9
Zhai, X., Guo, L., Liu, R., and Zhang, Y. (2018). Rainfall threshold determination for flash flood warning in mountainous catchments with consideration of antecedent soil moisture and rainfall pattern. Nat. Hazards 94, 605–625. doi: 10.1007/s11069-018-3404-y
Zhang, M., and Meng, Z. (2018). Impact of synoptic-scale factors on rainfall forecast in different stages of a persistent heavy rainfall event in South China. J. Geophys. Res. 123, 3574–3593. doi: 10.1002/2017JD028155
Keywords: flood early warning systems, rainfall thresholds, flash floods, case studies, methods, indicators, predicting variables
Citation: Henao Salgado MJ and Zambrano Nájera J (2022) Assessing Flood Early Warning Systems for Flash Floods. Front. Clim. 4:787042. doi: 10.3389/fclim.2022.787042
Received: 30 September 2021; Accepted: 14 February 2022;
Published: 10 March 2022.
Edited by:
Rodney Martinez, World Meteorological Organization, SwitzerlandReviewed by:
Subimal Ghosh, Indian Institute of Technology Bombay, IndiaFederico Gómez, World Meteorological Organization, Switzerland
Copyright © 2022 Henao Salgado and Zambrano Nájera. This is an open-access article distributed under the terms of the Creative Commons Attribution License (CC BY). The use, distribution or reproduction in other forums is permitted, provided the original author(s) and the copyright owner(s) are credited and that the original publication in this journal is cited, in accordance with accepted academic practice. No use, distribution or reproduction is permitted which does not comply with these terms.
*Correspondence: María J. Henao Salgado, mjhenaos@unal.edu.co
†ORCID: María J. Henao Salgado orcid.org/0000-0002-1302-9916
Jeannette Zambrano Nájera orcid.org/0000-0002-9674-7621